
")
-
Home

-
Products
-
-
Manufacturers and Suppliers
-
CED
- Spike 2
Spike 2

Spike2 is a multi-channel continuous data acquisition and analysis package. Uses range from a simple chart recorder to complex applications requiring stimulus generation, data capture, scrolling or triggered displays, control of external equipment and custom analysis. This flexibility makes it ideal for applications in many fields including electrophysiology, neurophysiology, cardiovascular and respiratory studies, sports science and pharmacology.
- Spike2 includes recording and analysis features suitable for a wide range of research applications.
- Spike2 has the power and flexibility for demanding applications, for example extracellular multi-electrode recording and complex stimulus timing and delivery.
- Spike2 has the sampling and analysis features most researchers need. A built-in script language automates repetitive tasks with additional functions for custom analyses and applications.
- Spike2 imports data recorded by many other systems, you can take advantage of this extremely versatile software to analyse existing data.
- Spike2 can export data to spreadsheet, text, binary and MATLAB® files.
- Spike2 is continually updated; the latest version adds new features for free throughout the life cycle of the version.
These powerful data capture and analysis functions, together with one of the CED1401 family of laboratory interfaces, make Spike2 an extremely flexible, cost-effective and time-saving addition to any laboratory.
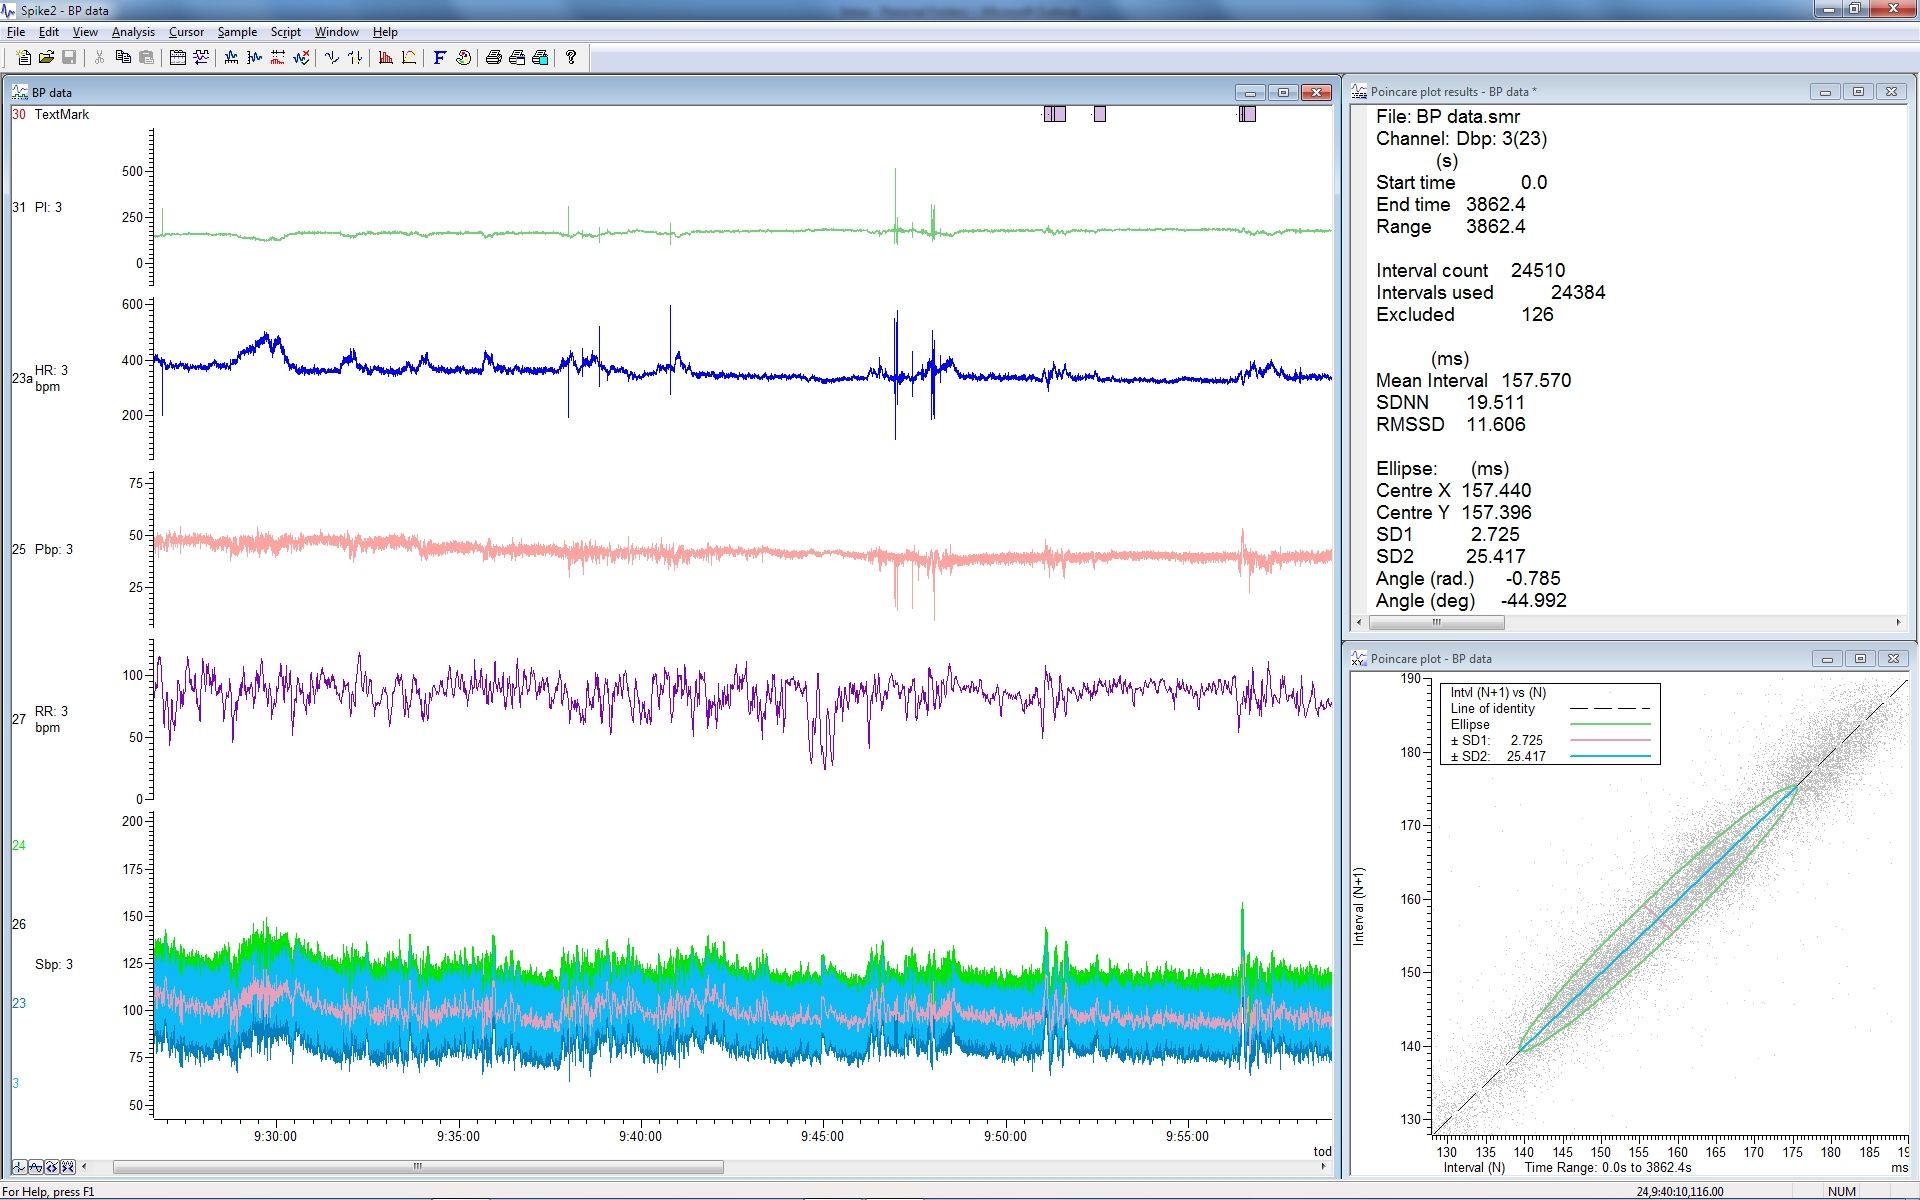
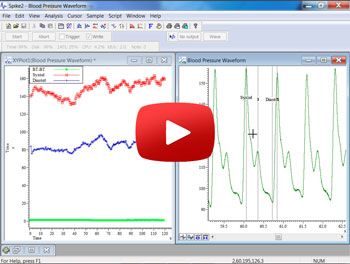
Heart rate and blood pressure variability analysis including Poincaré plot with fitted ellipse
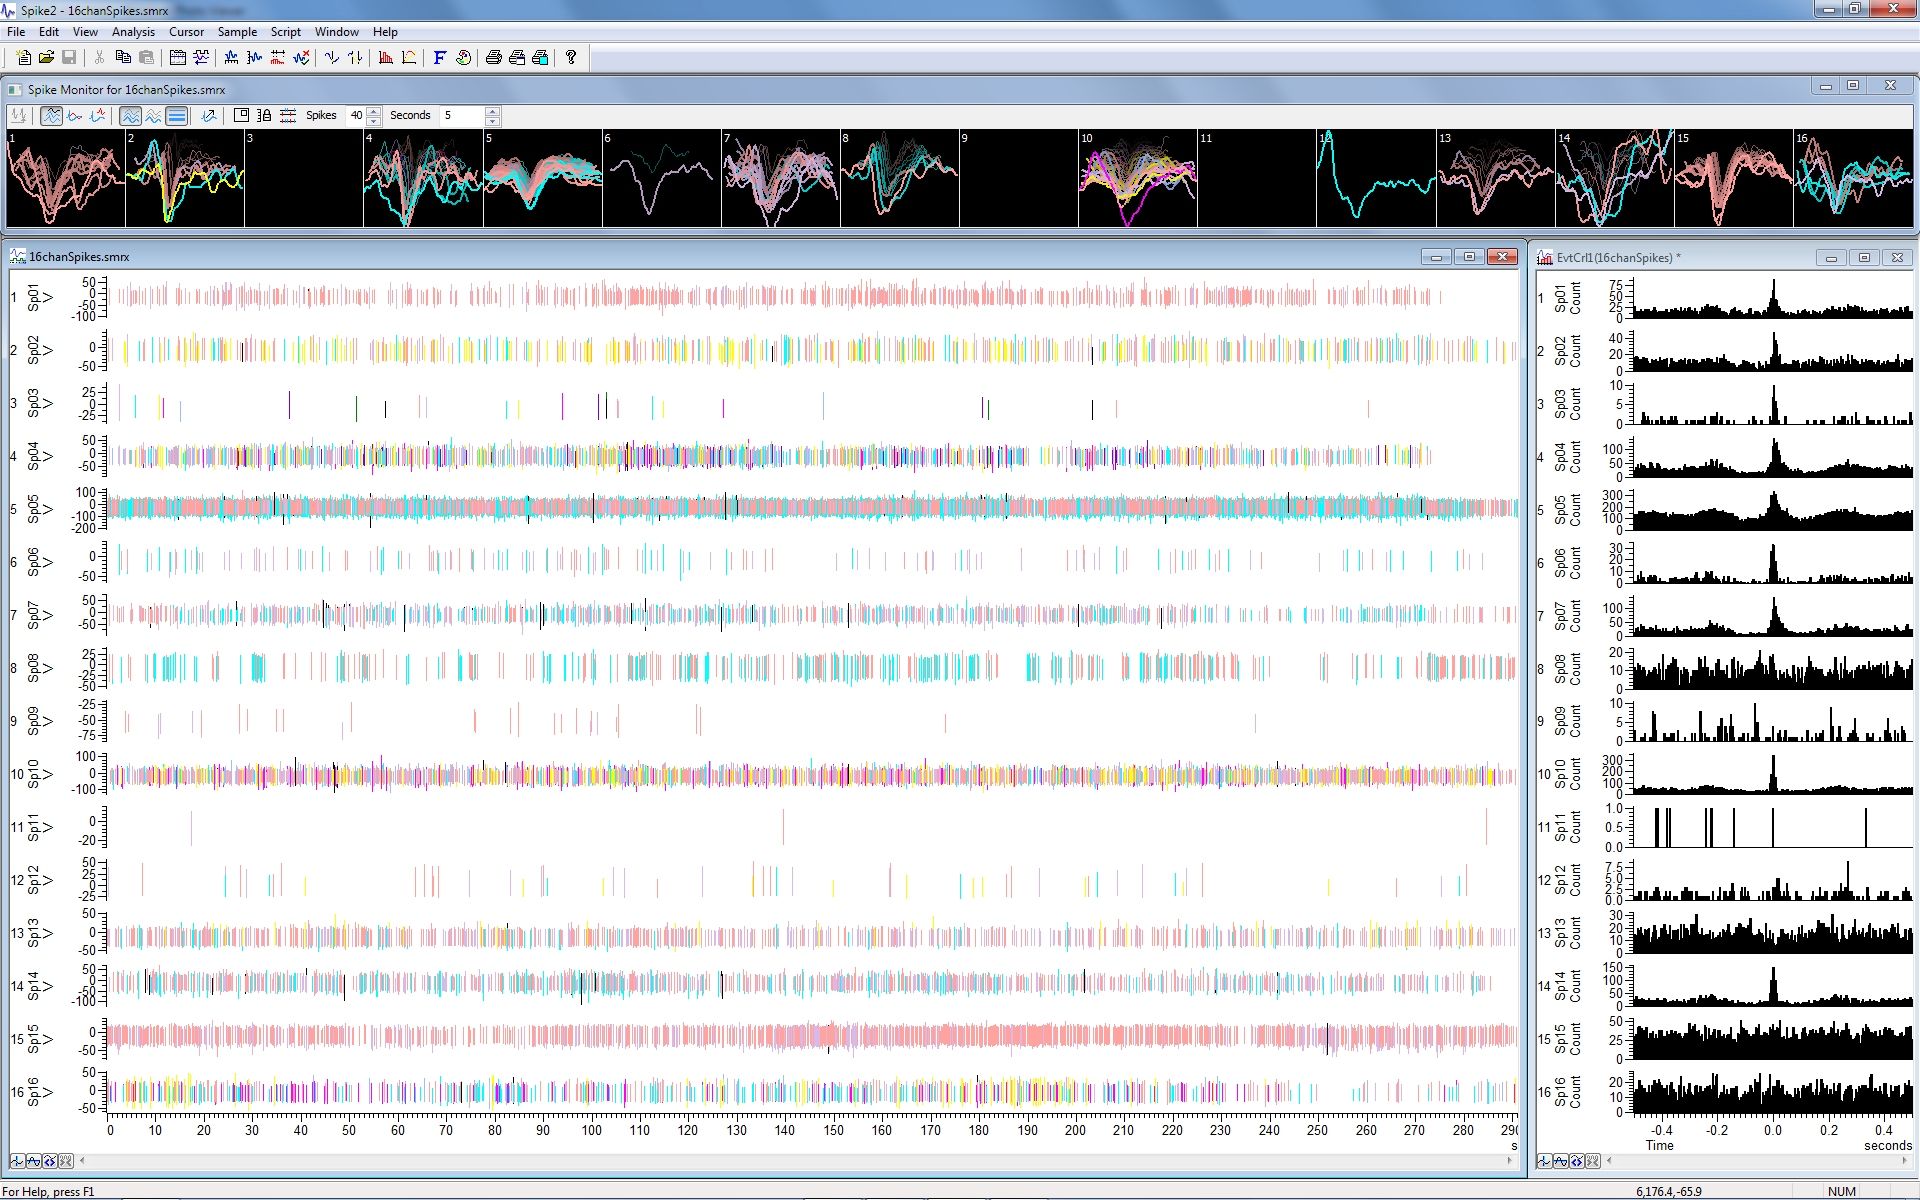
Multi-channel on-line spike discrimination with 'spike monitor' display
Features
- Navigate through your data quickly and simply using the intuitive user interface; zoom and scroll with the mouse or keyboard.
- Record multiple data types, including waveforms, event times, coded markers, and discriminated single or multi-unit spike data.
- Generate simple and complex protocols of waveform and pulse outputs.
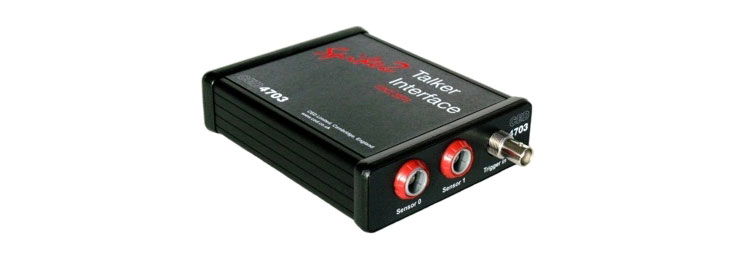
- Acquire data from third-party devices using CED Talker software modules. Data can be sampled with or without a 1401 interface.
- Detect features automatically or manually and take measurements based on triggered and cyclical data.
- Analyse multiple channels of waveform and event data on-line and off-line.
- Process data with functions including: filtering, rectification, interpolation, spectral analysis and inter-channel arithmetic.
- Display and export images as you want them, with versatile display options including: triggered update with optional overdraw and 3D display and duplicated windows with independent display settings.
- Record very large numbers of channels by synchronising multiple CED 1401s.
- Customise the program with the built-in script language that provides control from simple automation to addition of complex analysis functions.
- Replay data files, with simultaneous output of waveform data through 1401 analogue outputs (DACs) or computer sound card.

Script driven detection and classification of seizure activity in EEG
Data Acquisition
- Record to the 64-bit format of virtually unlimited size and duration or use the established 32-bit format for backwards compatibility.
- Set different waveform sample rates per channel.
- Capture and classify single and multi-unit spike activity in real-time.
- Continuous, internally timed and triggered recording modes.
- Store up to 8 channels of event data with microsecond timing resolution.
- Log accurately timed coded 8-bit digital inputs.
- Annotate data records with text notes and keyboard markers.
- Sample data from other equipment using the CED Talker interface.
- Swap between experiment setups quickly with a single mouse click.
- Calibrate waveforms with multiple methods including values, areas, slopes.
- Automatically save and sequence multiple files with optional trigger start.
- Recover data files in the event of an un-commanded system shutdown.
- Configure dynamically programmable amplifiers including the Digitimer D360 and D440 and the Power1401 gain option.
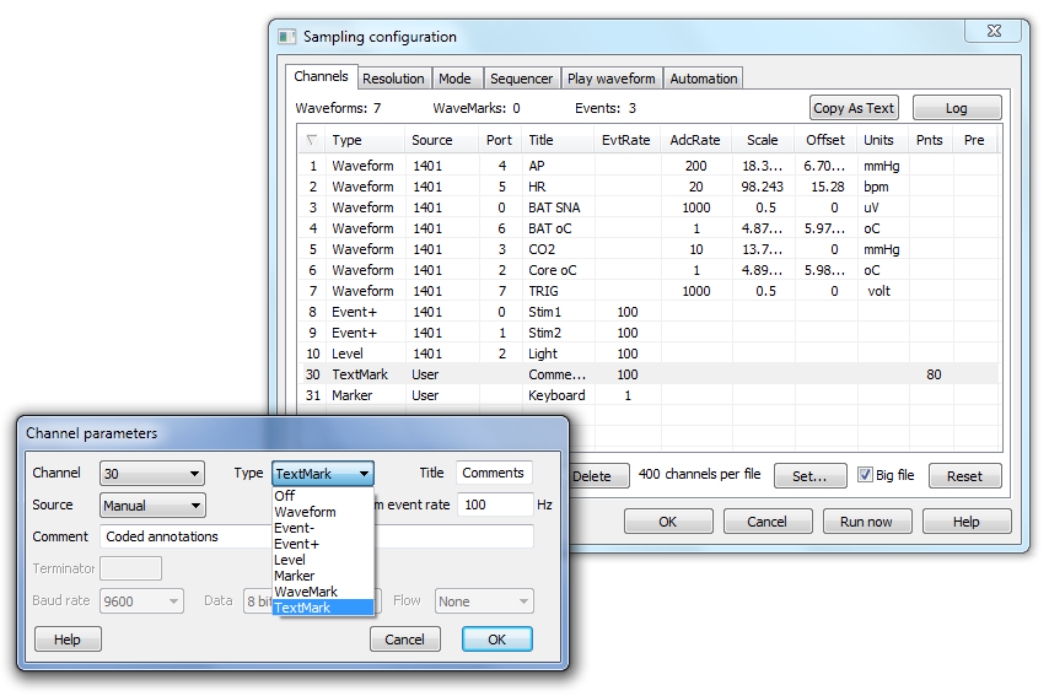
Spike2 sampling configuration dialog
Software Demo
Experiment control and stimulus sequencing
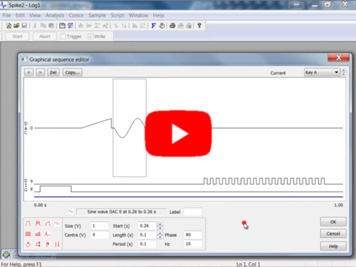
The Spike2 output sequencer can run complex experiment control and stimulus sequencing protocols during data capture using up to 16 TTL and 8 waveform outputs. Timing is precise as it is controlled at the CED 1401 interface, not the host computer.
Output protocols can be set up in two ways. A graphical editor provides all the functionality most users require, allowing creation of multiple sets of pulse outputs including square pulses, sine waves, ramps, pre-recorded and user-defined waveforms:
For more demanding applications, a text editor is available in which you can edit the sequencer steps directly. This makes it possible to control the sequence interactively through the script language by use of variables and tables.
The sequencer can access the incoming waveform and event data in real-time, enabling very fast response to changes in waveform levels and detection of events.

Spike2 graphical sequence editor showing different outputs and additional control options
Spike detection and sorting
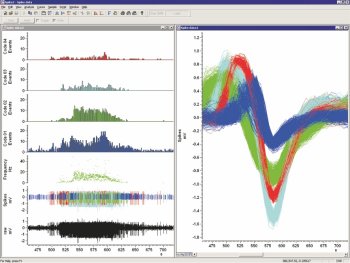
Spike2 identifies and sorts single and multi-unit activity both on- and off-line. It can mark events using simple threshold crossings or sort up to 32 channels on-line with whole wave spike shape template matching of single trace and n-trode data.
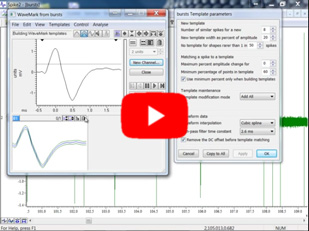
For multi-unit recordings, Spike2 contains tools for sorting spikes based on the spike waveform shape. All events crossing a threshold are captured.
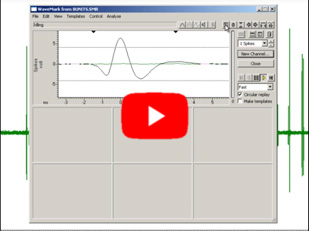
A combination of template matching and cluster cutting based on Principal Component Analysis (PCA), user-defined measurements correlations or errors is then used to sort spikes into different units. Spikes can also be sorted interactively by dragging a line through overdrawn spikes and classifying any which intersect. Spike Collision Analysis can separate unit collisions by comparing the current spike shape with pairs of existing templates.
Cluster cutting methods plot measured values into a 3D view that can be rotated and replayed to show the occurrence of the spikes through time. Clusters are formed by automatic algorithms or manually by placing ellipses or drawing polygons. Interactive features include INTHs for current cluster classes, tracking over time, and selection of an individual spike by clicking on its dot in the cluster.

Multi-unit spike discrimination using PCA clustering
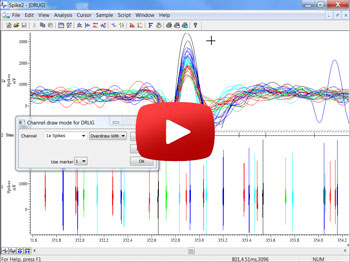
Spike data draw modes
Display
- Review multiple files simultaneously, even when sampling.
- Navigate through data files with simple mouse pan and zoom, axis dragging, scroll bar and keyboard control.
- Display events, spikes and markers as times, rates, mean and instantaneous frequencies; discriminated spikes can be overdrawn:
- Use duplicated channels to display data in different ways and show selected markers and discriminated spikes separately for cross analysis.
- Overlay multiple triggered 'sweeps ' with optional 3D display.
- Draw waveforms with optional linear and cubic spline interpolation or as frequency sonograms with preset and user-defined colour scales.
- Draw marker type data in State mode for condition marking. Textmark (text note) channels can also display stored text in the channel area:
- Extend event or coded time markers across all channels in data view.
- Set independent colours for each channel's data and background.
- Arrange vertical space and order of channels displayed, including option to overlay multiple channels.
- Display linear or logarithmic axes in result and XY views.
- Expand your display area with built-in multiple monitor support multiple files simultaneously, even when sampling.

Response of insect auditory receptor to pure tone stimuli and calling song
Analysis
- Waveform analyses including averaging, power spectra and waveform correlations
- Event analyses including INTH, PSTH, auto and cross correlations and phase histograms
- Automatically find data features including triggers and features in evoked, spontaneous activity and cyclical data with 'active' cursors:
- Generate XY plots and data file channels holding measurements based on cursor feature detection, and output tables of measurement values
- Take absolute and relative measurements of positions, data values and inter-cursor statistical measurements with up to 10 active cursors per view
- Quickly take time and amplitude measurements using the mouse pointer
- Derive 'virtual channels' from existing waveform and event channels defined by user-supplied expressions (channel arithmetic). Options include mathematical functions, spectral analysis and comparison operators
- Generate functions in 'virtual channels', including sine, square, triangle waves, envelopes and polynomials
- Process waveforms dynamically on- and off-line. Processes include rectify, smooth, DC remove, downsample, median filter and RMS amplitude
- Create editable temporary channels containing copied or derived data
- Digitally filter waveforms (FIR and IIR) with interactive filter design
- Interactively fit data with functions including exponential, Gaussian, polynomial, sinusoid and sigmoid
- Automate repetitive, multi-step and custom analyses using the script language
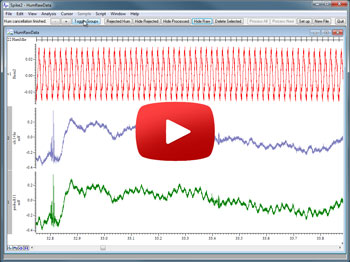
- Script advanced processes, for example hum removal from any number of waveform channels using the CED 4001-16 Mains Pulser.
Script language
Anyone, from complete beginners to experienced programmers, can benefit from the built-in Spike2 script language. Simple automation of repetitive tasks with known parameters can save hours or even days of tedious analysis. Advanced applications include complete experiment control with on-line application of original algorithms to sampled data in real-time.
The script language not only links Spike2 features but also allows you to generate your own interfaces and design algorithms. A simple macro recording facility provides a starting point for new scripts. The script language also includes data manipulation tools such as multi-dimensional arrays and matrix functions.
CED maintains a library of scripts for a wide range of common and specialised applications. If the scripts included with the Spike2 software or those available from our web site do not meet your needs, please contact us to discuss the available options. These include modification of existing scripts as well as a dedicated script-writing service.
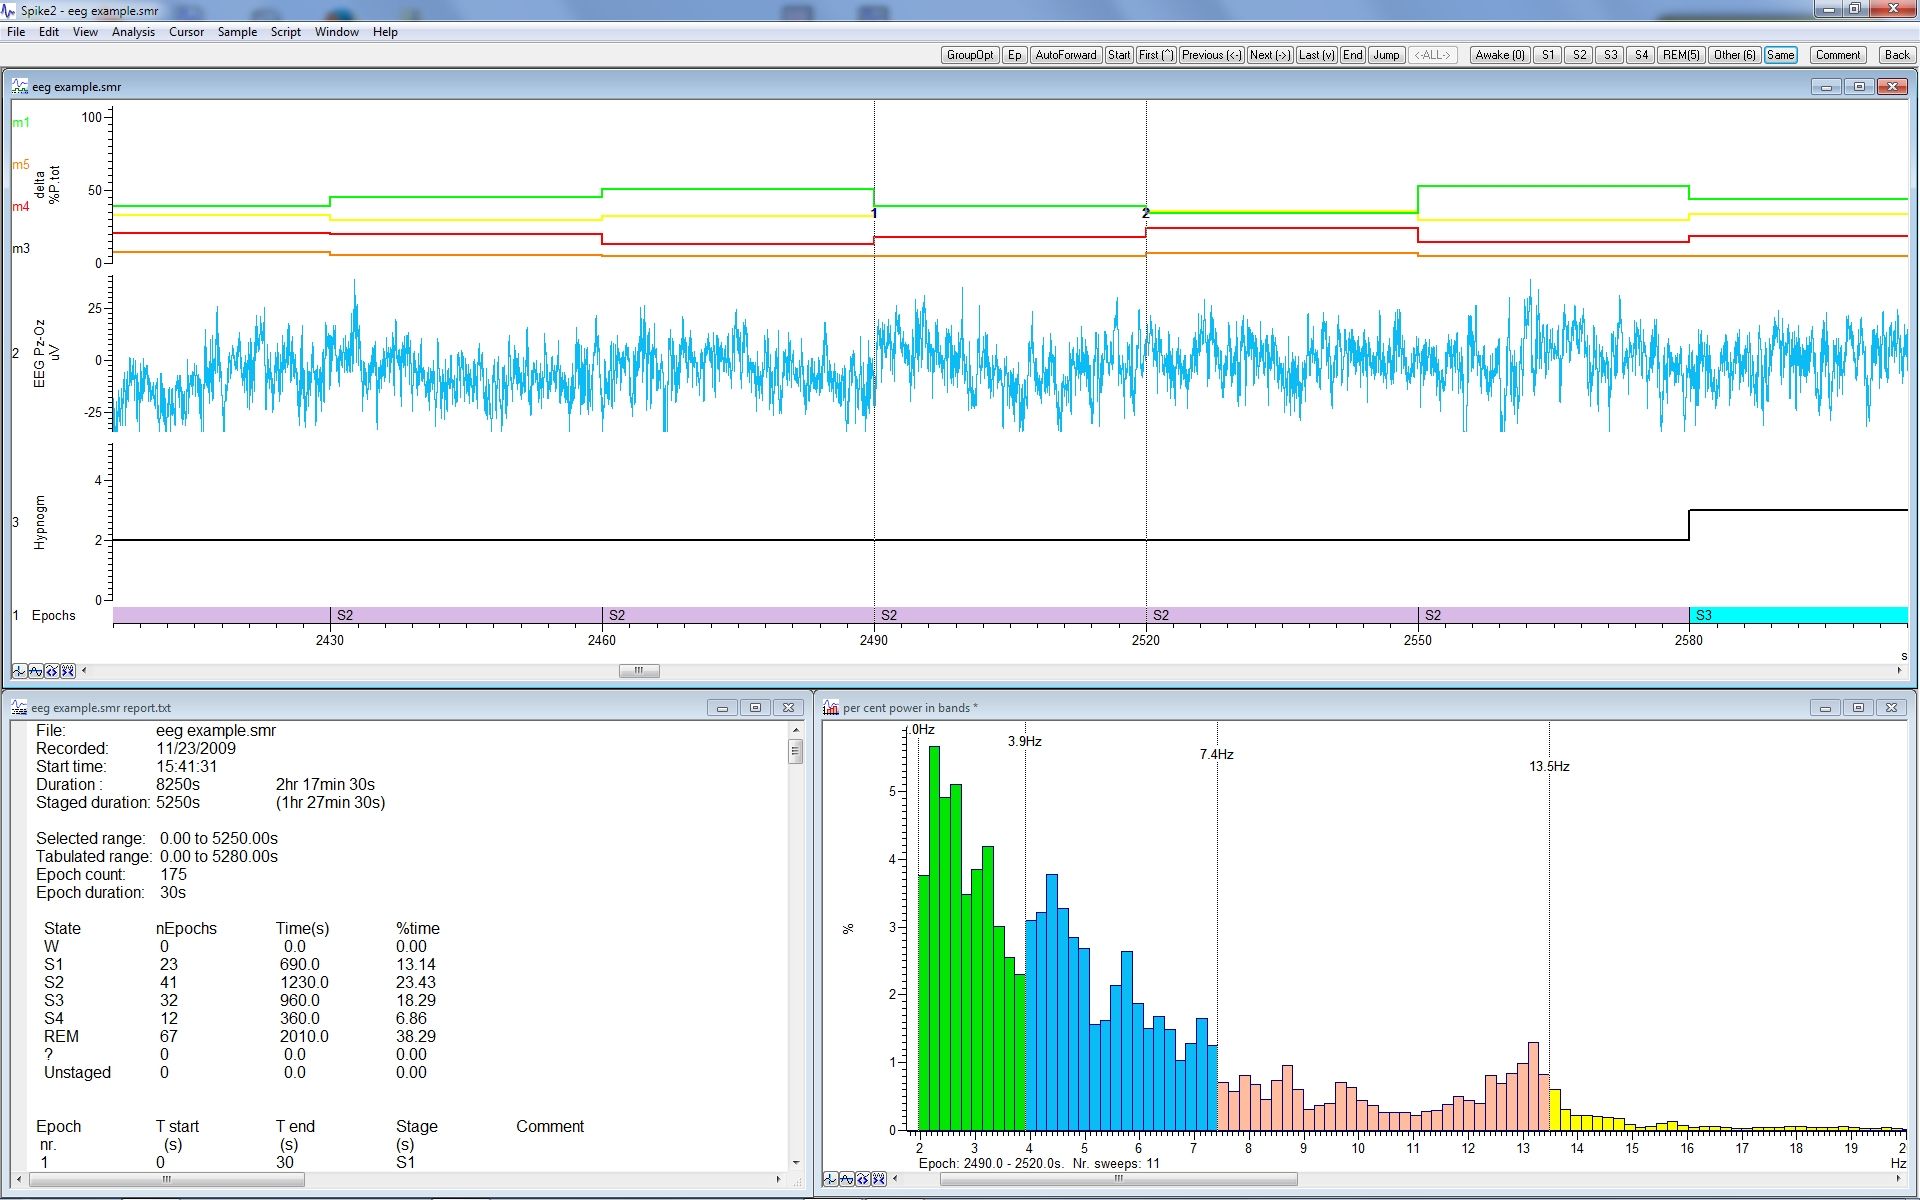
Scripted sleep stage scoring and analysis
System requirements
Spike2 version 10 requires a CED Power1401, a Micro1401-4, a Micro1401-3, or Micro1401Mk II PC and a Windows 7, 8, 10, or Intel Macintosh running Windows. The computer must be modern enough to support the SSE2 instruction set. We recommend that the PC has a minimum of 8 GB RAM and runs Windows 10.
Both 32-bit and 64-bit versions of Spike2 are supplied: either version of the software can be used on systems running a 64-bit OS. The 64-bit version provides a performance increase and access to more memory.
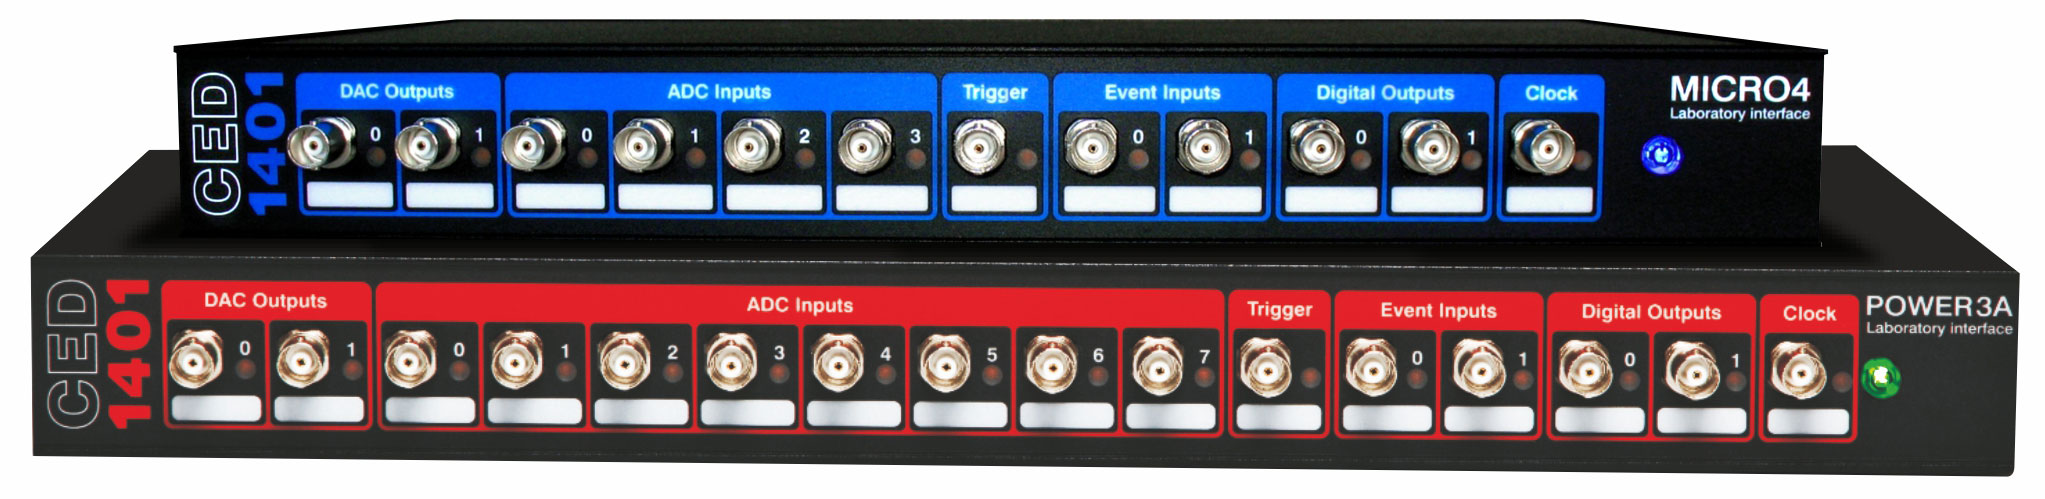
The Micro1401-4 and Power1401-3
Also see:
|
i. e. Signal |
|
|
-
Home
-
Products
-
-
Manufacturers and Suppliers
-
CED
- Spike 2