Axon™ pCLAMP™ 11
The Axon™ pCLAMP™ Software Suite from Molecular Devices is the most widely-used electrophysiology data acquisition and analysis program for control and recording of voltage-clamp, current-clamp, and patch-clamp experiments. Axon pCLAMP 11 consists of Clampex 11 for data acquisition, AxoScope 11 for background recording, Clampfit 11 for data analysis, and now the new optional Clampfit Advanced Analysis Module for a more sophisticated and streamlined analysis.
Key features:
- Program advanced experimental protocols with enhanced Protocol Editor
- Analyze data more accurately with new Population Spike and Action Potential Analyses
- Accelerate your results with the new Automated Event Detection and Batch Data Analysis Macros in the new Clampfit Advanced Analysis Module.
The focus of the Axon pCLAMP 11 Software Suite is to provide users with greater flexibility in controlling acquisition of electrophysiology data. The previous Clampex 10 version already has a powerful built-in feature set including flexible Protocol Editor, Membrane Test, P/N leak subtraction, User List and Sequencing Keys, etc. In Clampex 11, we enhance this flexibility even more with a new Protocol Editor featuring an increased number of Epochs and increased sweep duration in Episodic Stimulation acquisition mode. Gap-free mode is greatly improved with the ability to execute episodic-style Epochs and programming of digital and analog outputs. The new Membrane Test in Clampex 11 now allows viewing of multiple channels simultaneously. Independent voltage output at different stage configurations is enabled in each recorded cell. These new features provide Clampex 11 unparalleled ease-of-use, which makes it the software-of-choice for controlling experiments.
Episodic and continuous recording modes
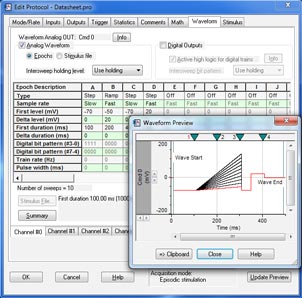
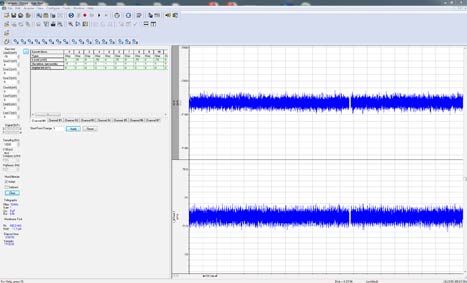
Clampex 11 is a superior program for stimulating cellular preparations in a sweep-oriented “episodic” mode. Stimulus waveforms can be created from a variety of sources, such as the Protocol Editor in Clampex 11, pCLAMP ABF data files, and ASCII text files. The new Protocol Editor (Fig. 1) has been enhanced to allow 50 Epochs in episodic stimulation, and the maximum sweep duration has been extended to 516 seconds at 10 KHz sampling. Gap-free recording (Fig. 2) now features the ability to execute waveforms as well as the ability to program analog and digital output signals. Standard protocol patterns include steps, ramps, cosines, trains of pulses (biphasic), sinusoidal, or triangular patterns. Waveform stimulation utilizes a variety of timing and triggering aids, including software protocol controls and sequencing, hardware, software, and manual triggering options. Clampex 11 supports eight digital output bits during sweeps and eight simultaneous waveforms when used with the Digidata® 1550B digitizer. Advanced “split-clock” capability allows users to shift the sampling rate on a per-Epoch basis during sweeps, such as slowly changing conditioning or recovery phases of cell stimulation. For ease-of-use, all protocol durations are defined in terms of time and sampling rates in terms of frequencies.
For continuous recording, four different modes are available. Gap-free recording is a simple continuous “chart-recorder” recording mode useful for monitoring single channel events, minis, and other spontaneous activity. New in Clampex 11, users can now execute protocol-editor-style Epochs and program digital or analog outputs in Gap-free recording. Fixed- and Variable-Length Event Detection modes are suitable for recording spontaneous events of regular length or varying length that are separated by long periods of inactivity. The high-speed oscilloscope mode works like a storage oscilloscope to capture triggered fixed-length sweeps of data. By providing all of these recording modes, Clampex 11 provides the functionality necessary for a variety of simple and complex experimental protocols.
Filtering and corrections to data
Clampex 11 can be used to offset voltage level differences between connected instruments, correct liquid junction potentialerrors arising from ionic solutions, compensate passive leak currents with P/N leak subtraction, or reduce high-frequency noise spikes and slow baseline drift with highpass and lowpass filtering. Clampex 11 works to compensate for a wide variety of introduced noise sources. Amplifier gain and filter settings for the Axoclamp™ 900A and MultiClamp™ 700B microelectrode amplifiers are software-telegraphed so microelectrode amplifier settings are stored with the data. With Clampex 11, the latest BNC-telegraphed amplifiers are also supported.
Cell monitoring
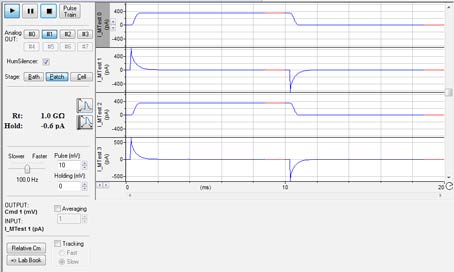
The Membrane Test window (Fig. 3) in Clampex 11 allows experimenters to monitor pipette resistance in the bath, formation of high-resistance seals between a cell and a pipette, and to measure cell capacitance (Cm), membrane resistance (Rm), and access resistance (Ra). In Clampex 11, Membrane Test has been greatly enhanced. When using multiple channels, all Membrane Test channels will be displayed on a window simultaneously, allowing experimenters to view the status of each channel in one view. Independent voltage output at different stage configurations is enabled in each recorded cell. These features allow an entire experiment to be recorded in a single file while simultaneously monitoring crucial cell parameters in real time.
Online analysis
To analyze data in real-time, the Clampex 11 features online analysis. With online analysis, multiple regions can be simultaneously analyzed by an extensive set of peak-based measurements, such as peak amplitude, area, mean, and standard deviation. Measurement regions can be adjusted in real time for LTP experiments. Several measurements, such as half-width, rise and decay times, and rise and decay slopes, are useful for cardiac analyses. Measurements are displayed in their own windows, and different trace colors are used to identify each search region to simplify interpretation.
Sequencing Keys
Sequencing Keys control the setup and timing of operations, including loading protocols, recording data, setting analog and/or digital holding levels, running the Membrane Test, inserting comments into the Lab Book and data file, and linking to the next operation. By using Sequencing Keys, complex experiments can easily be automated, providing a powerful way to link the actions of an entire experiment.
Clampfit 11: smart data preparation and analysis
The Clampfit 11 offers dedicated functions to quickly prepare and analyze data. Noise can be removed from signals using highpass, lowpass, and bandpass filters with Bessel, Butterworth, Chebyshev, Gaussian, or RC responses. Specialized notch and electrical interference filters can be used to remove specific noise frequencies and harmonics from recorded signals. Several different methods are available to adjust the baselines of recordings: constant values or averages can be subtracted from all points of the recording, linear drifting baselines can be adjusted by applying a slope correction, or, for unstable baselines, a manual correction using a poly-line can be applied. Additional data analysis functions are averaging, normalization, control subtraction, and peak alignment.
Data analysis
Included with Clampfit 11 is a comprehensive palette of tools for analyzing and graphing electrophysiological data. For curve fitting, users can select from 37 pre-defined functions or define their own. Fits can be customized by selecting fitting methods and applying fitting seeds, models can be compared with different terms, and fits can be extrapolated to view curves, components, residuals, taus, etc. Specialized analysis tools include Fast Fourier Transform, Variance-Mean analysis, Perievent analysis, Burst analysis, and other statistical analyses. To display results and data, a range of graph types are available in the Graph windows.
Graphs are dynamically linked to their Results window so any manipulations made in the Results window updates the corresponding data in the Graph window. Numerous peak statistics can be directly measured. In this latest version, experimenters can select 24 separate regions of interest as well as a baseline region, thus enabling the analysis of complex data. Online statistics can be recreated during offline review, eliminating the need to save separate statistics files during acquisition. A power spectrum (FFT) for noise analysis can be applied to individual, averaged, or segmented spectra and produces a log-scaled graph of the results. Standard auto and cross-correlation analyses provide the means to compare data for patterns within or across populations. For synaptic modulation studies, the V-M analysis in Clampfit 11 provides a robust method for pre-/post-synaptic site identification.
Event detection analysis
Clampfit 11 has extremely flexible event detection that analyzes spontaneous and evoked action potentials and post-synaptic data. Events are detected by either crossing a threshold or through a pattern-matching Template Search. Template Searches are designed for analyzing spontaneous events, such as miniature synaptic EPSPs and IPSPs. These events vary in amplitude but not shape, and thus are ideal for detection by the Clampfit 11 scalable shape-based algorithm. For added flexibility, multiple categories of events can be simultaneously detected and sorted for secondary analysis. The integrated environment of Clampfit 11 links the detected events in the data to the spreadsheet and graph windows to enable quick evaluation of the information within the context of the entire dataset.
Single-channel analysis
The Clampfit 11 single-channel analysis allows full processing of up to 1 million events on continuous and episodic data. Open, closed and sub-conductance states of ion channels in natural or artificial membranes are detected and measured. Up to eight levels of open states are supported.
An adjustment for baseline drift can be automatically applied, and an idealized record of the channel activity created. Amplitude and dwell-time histogram plots, including log and cumulative plots, can be created. Clampfit 11 also has specialized analyses, such as P(open), burst analysis, latency analysis, evoked response analysis, and nonstationary fluctuation analysis to estimate channel conductance.
Spreadsheet analysis
Primary analysis results populate a spreadsheet where secondary analyses can be performed. These results can be analyzed within Clampfit 11 or exported to Microsoft Excel for further analysis. The secondary analyses available within Clampfit 11 are analysis of variance, F-test, Chi-squared, Kolmogorov-Smirnov, rank correlations, and Student’s t-Test. Graphing secondary data can be as easy as selecting a data column and clicking on the Create Graph button. Available graphing options include line, scatter and various histogram plots (e.g., normalized, frequency, log [square root] and cumulative).
Clampfit Advanced Analysis Module
The Clampfit Advanced Analysis Module is a set of tools that expands the capabilities of Clampfit to combine powerful analyses with ease-of-use. Data analysis has traditionally been a bottleneck in the patch-clamp experimentation workflow. The Batch Analysis Macros within the Clampfit Advanced Analysis Module solve this problem by applying automation principals to analyze similar data sets. Additionally, the Clampfit Advanced Analysis Module has specialized algorithms to extend the capabilities of Event Detection. Use the enhanced Automated Event Detection to eliminate the need for cumbersome third-party data analysis packages and go from data acquisition to results quickly and easily, in one simple-to-use software, without data file conversion.
Automated Event Detection
The Clampfit Advanced Analysis module provides an enhancement to the already-sophisticated Automated Event Detection engine built into Clampfit. Simply load your data file in Clampfit and highlight the portion of your data file to search. Automated Event Detection will identify events based on user-defined parameters. Event detection has been enhanced to provide automated detection and measurement of population spikes and paired pulses. During detection, programmatically-determined measurements can be edited by graphically repositioning the peaks and end points of the events. If included in an optionally specified search region, stimulus artifacts are automatically detected and used to determine latency times. Multiple spike responses and paired pulse data are processed with no additional set-up requirements.
Action potential detection and measurement has been considerably enhanced and assigned to a separate detection option which allows for the selective measurement of all action potential properties such as rise and decay times, threshold potentials, after-potentials duration and amplitude, and many more.
Population Spike Analysis
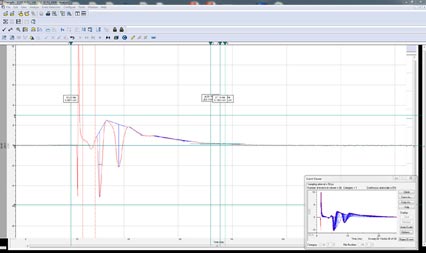
Population spike recordings (Fig. 4) and paired-pulse experiments, while simple to collect, have traditionally been difficult to analyze. That changes with the Advanced Analysis Module in Clampfit 11. The Population Spike Analysis tool uses interface where the experimenter can choose the direction of the spike and specify the area to be analyzed. This tool will automatically calculate the amplitude, area under the curve, half-width, rise time, decay time, rise slope, decay slope, coastline of population spikes, and paired-pulses. These values will be populated in the Result sheet where they can be used for downstream analysis.
Action Potential Analysis
Action Potential Analysis uses the Automated Event Detection engine to detect all action potentials in the data file. The Action Potential Analysis tool then automatically analyzes the data file determining the amplitude, APD90, rise time, decay time, rise slope, decay slope, peak-to-peak frequency, peak-to-peak time, change in amplitude per peak, afterpotential amplitude, afterpotential duration, and threshold potential. The Action Potential Analysis tool can also be used analyze action potential pulse train with the same ease.
Batch Data Analysis Macros
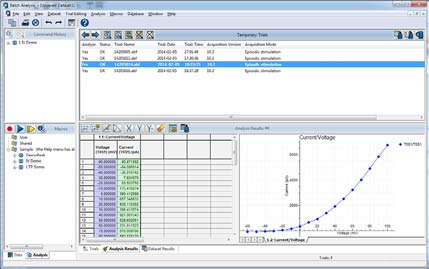
The Clampfit Advanced Analysis Module contains a Batch Data Analysis Macro (Fig. 5) that allows experimenters to apply macros to analyze acquired data. Batch analysis saves time by analyzing abundant amounts of data created by the same protocol. Just set up your analysis once and apply it to newly-acquired data. To use batch analysis, simply turn on the macro capture feature, analyze your data, and save the macro. When you have additional data to analyze which have been collected with the same protocol, simply apply the saved macro and your data is analyzed automatically.
System requirements
| Operating system | Windows 7 Pro (32- and 64-bit) or Windows 10 Ent (32- and 64-bit) |
| CPU | PC with 2.0 GHz (or faster) processor |
| RAM | 4 GB or higher |
| Display | 1440 × 900 resolution or higher |
| Ports | 3 USB (for Security Keys, Digitizer) |
|


